Tag Archive Common Lisp

ByLukas Körfer

Wave field synthesis with OM-SoX

Abstract: This final project was created at the end of the winter semester 2023/24 as part of the course “Symbolische Klangverarbeitung und Analyse/Synthese” (eng. Symbolic Sound Processing and Analysis/Synthesis) of the MA Music Informatics. An application for sound spatialization was developed in the program OpenMusic using the library OM-SoX implementing Steinberg and Snow’s “acoustic curtain”, a technique for wave field synthesis.

Responsible: Lukas Körfer

Wave field synthesis

Wave field synthesis (WFS for short) is the spatialization of virtual sound sources using a high-density loudspeaker array. This spatialization technique attempts to reproduce a physical soundfield over an extended area in a way to provide for multiple non-conicident listening positions a congruent impression of the localization of sound sources. This is achieved by generating a wave field consisting of a large number of individual sound sources that are synchronized in such a way that a coherent sound wave is created, for which given certain constraints it should be possible to localize a virtual sound source in the room.


For a better understanding of how WFS works, the subject can be approached via the physical phenomenon of interference pattern formation behind an obstacle with openings. When a wave encounters one or more slits, it is diffracted through the openings and propagates behind the obstacle. This leads to the formation of a pattern of wave interference on the other side of the obstacle. Similarly, wave field synthesis uses an array of loudspeakers to generate a coherent sound wave. This requires precise calculation and control of the phase and amplitude relationships of the sound waves emanating from each speaker. These calculations are dependent on the distances of each individual loudspeaker in the array relative to the position in space of the respective virtual sound source.

Project description

For this project, a program was to be created with the general goal of ultimately obtaining a multi-channel audio file that can be used for wave field synthesis with a loudspeaker array through certain influence and adjustments by a user. To achieve this, it was first necessary to design which parameters should be set and influenced by the user of the program.

User input


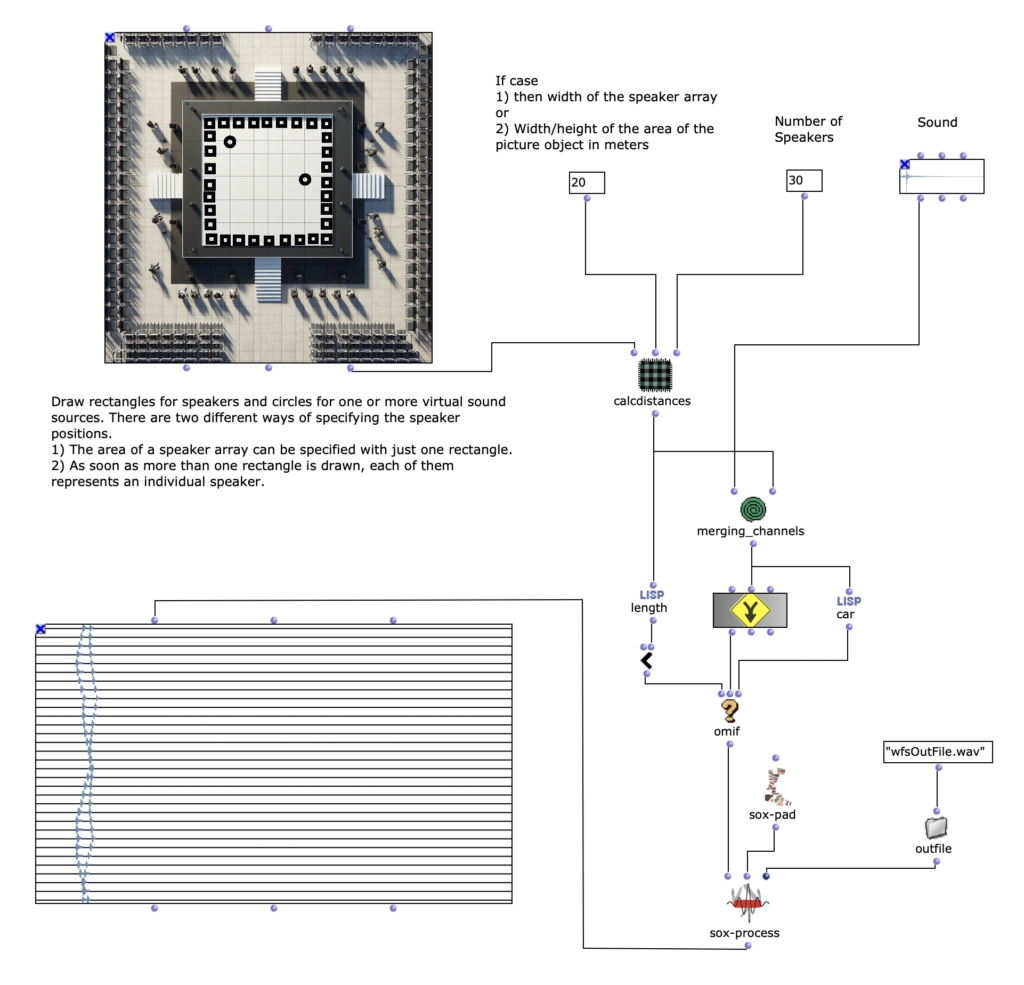
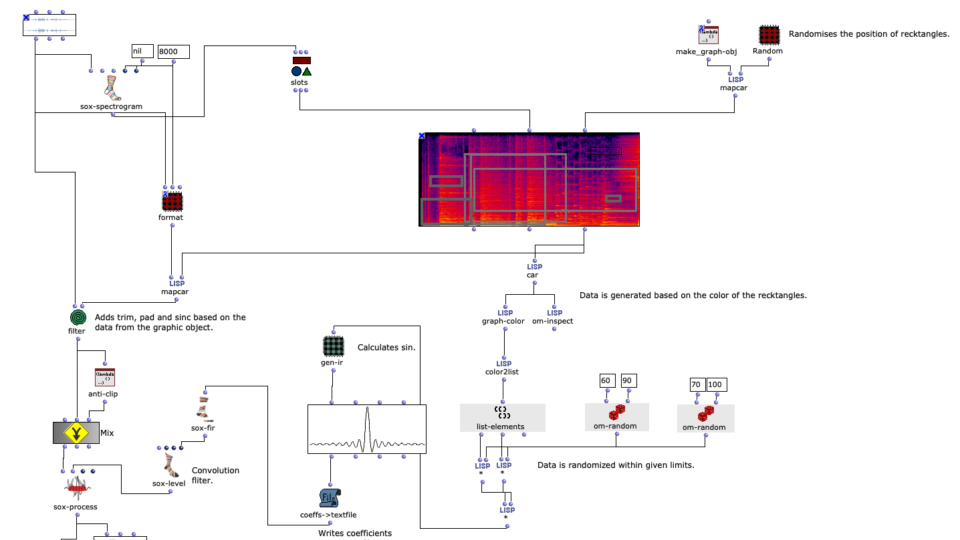
In addition to the audio file, which is to be used for spatialization, the user must specify certain information about the loudspeaker array on the one hand and the position or positions of one or more virtual sound sources relative to the loudspeaker array on the other. In order to make the configuration of the program as simple and intuitive as possible, I have decided to mainly use a picture object in which the structure can be recorded. The positions of the loudspeakers can be specified by drawing a rectangle and those of the virtual sound sources with circles. One or more circles can be drawn, with each circle representing a sound source. The loudspeakers can be specified in two different ways. If only a single rectangle is drawn in the picture object, this represents the area of a loudspeaker array. In order to be able to determine the specific positions of the individual loudspeakers in the next step of the program, two additional pieces of information are required. Firstly, the length of the loudspeaker array in meters; this also influences the scale for the complete drawn setup. Secondly, the number of loudspeakers in the drawn area must be specified. As soon as more than one rectangle is specified by the user, each individual rectangle represents an individual loudspeaker. In order to be able to specify a scale for the drawn structure in this variant – which was previously possible by specifying the length of the loudspeaker array – the width/height of the area of the complete picture object can now be specified. The first variant, where the loudspeaker array can only be drawn with a rectangle, makes the application much less complicated, but also requires the loudspeakers to be linear and evenly spaced.

Calculating distances


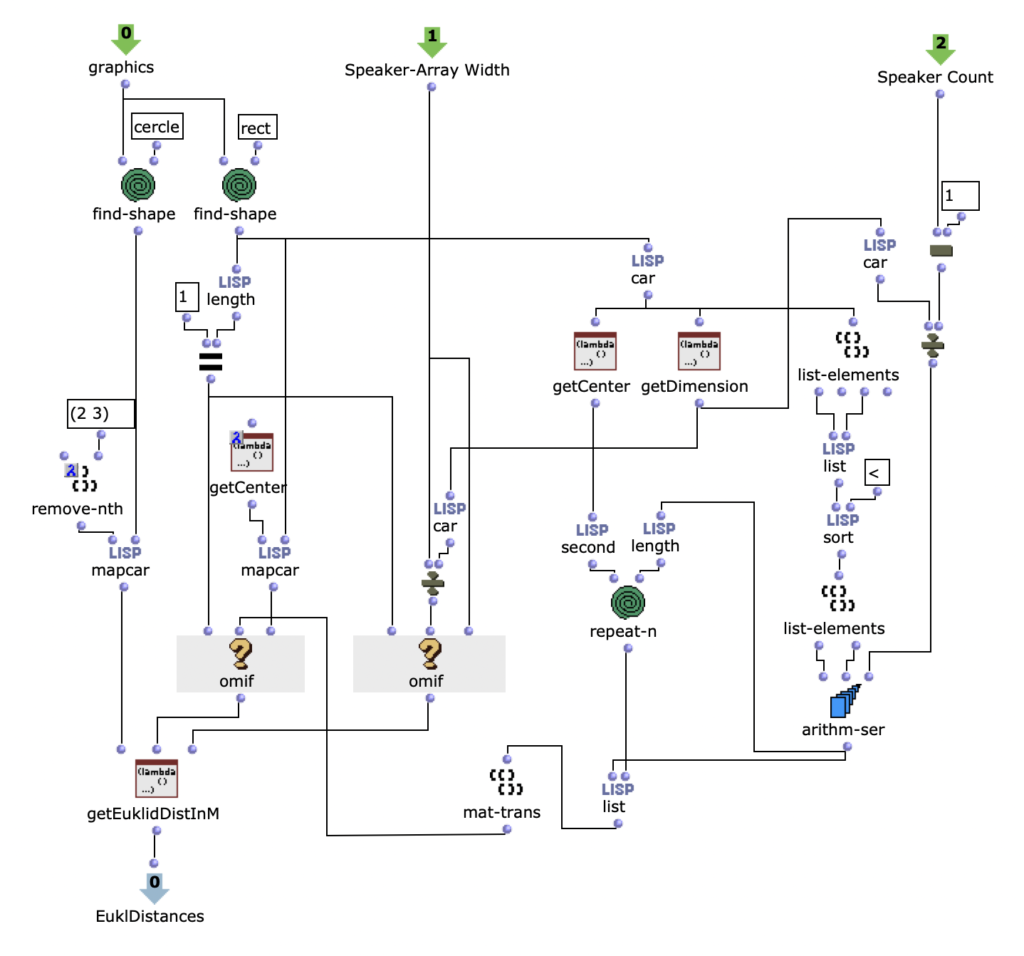
Once all the graphics of the picture object have been read out, they must be divided into rectangles and circles for further processing. If only one rectangle is found, the position and dimension of the rectangle and the two specifications for the length and number of loudspeaker arrays can first be used to determine the position of each individual loudspeaker within the array in meters. If there are several rectangles, this step is not necessary and the center points of all specified rectangles are simply determined. It is then possible to calculate the Euclidean distance from all sources to each individual loudspeaker on the same scale using another Lisp function. It should be noted that all graphics drawn by the user in the Picture object that do not correspond to a rectangle or a circle are ignored and not taken into account for the further calculations. As any number of virtual sound sources can be specified for the application, all circles that exist in the picture object are also captured in this step, whereby the order is irrelevant.

Sound processing


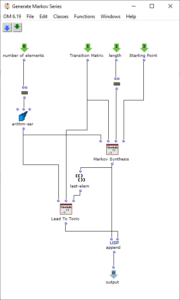
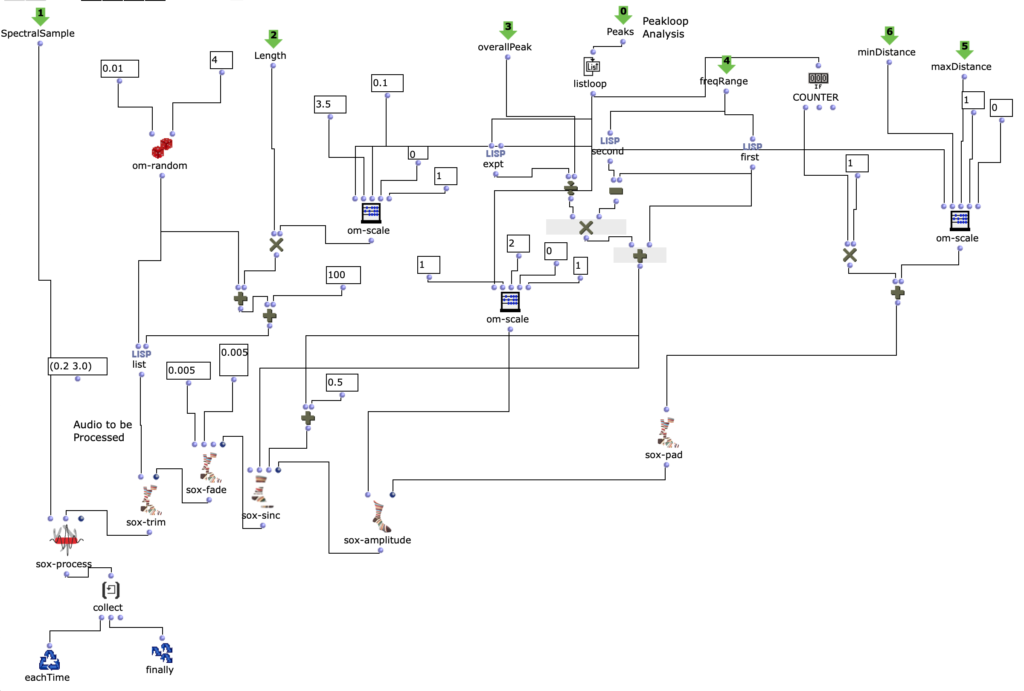
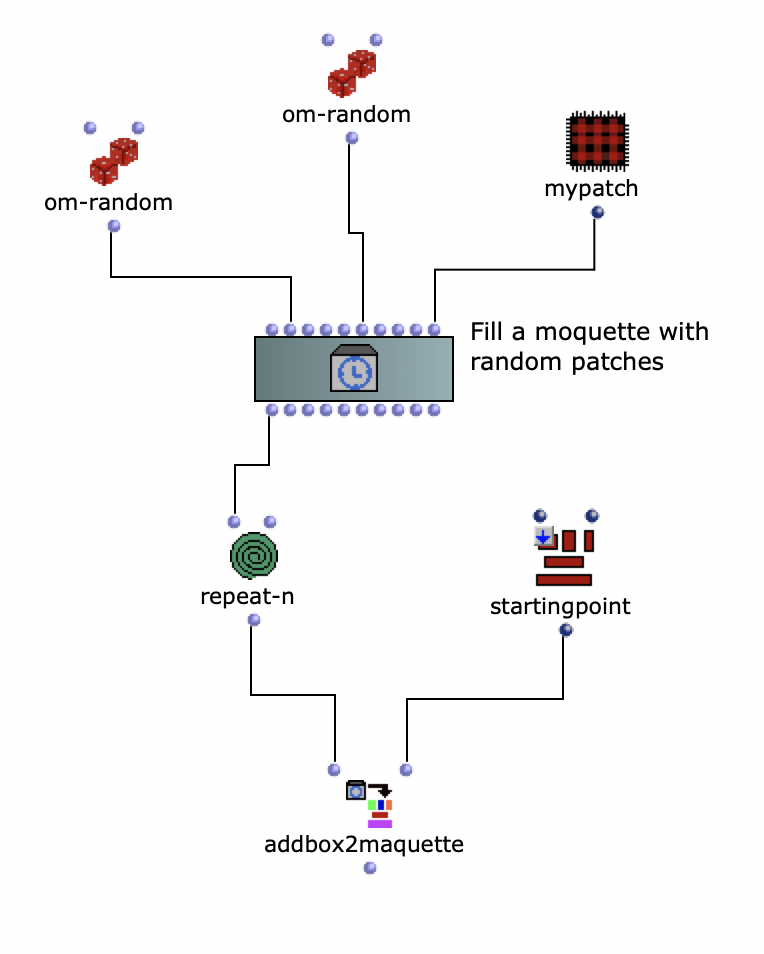
Sound processing is implemented in the next section of the program. Basically, a multi-channel file is created with the sound file specified by the user together with the previously calculated distances, which can be used for the intended loudspeaker array. This process takes place in a nested OM loop with two levels.


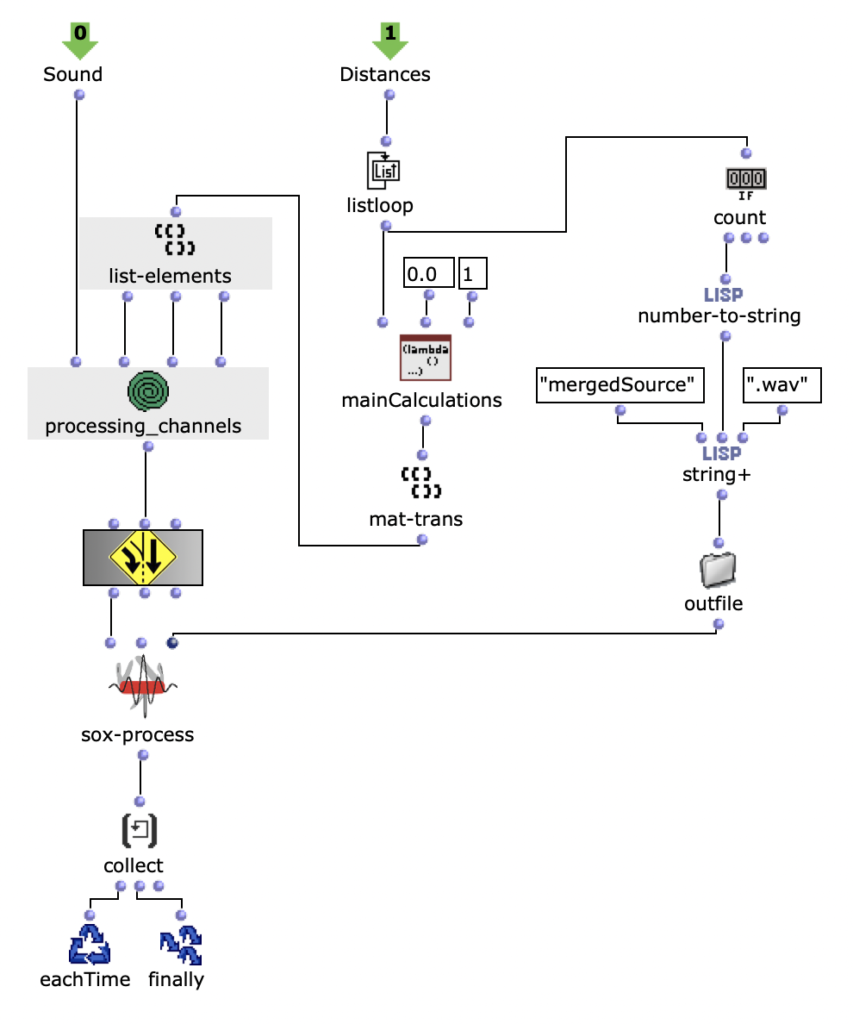
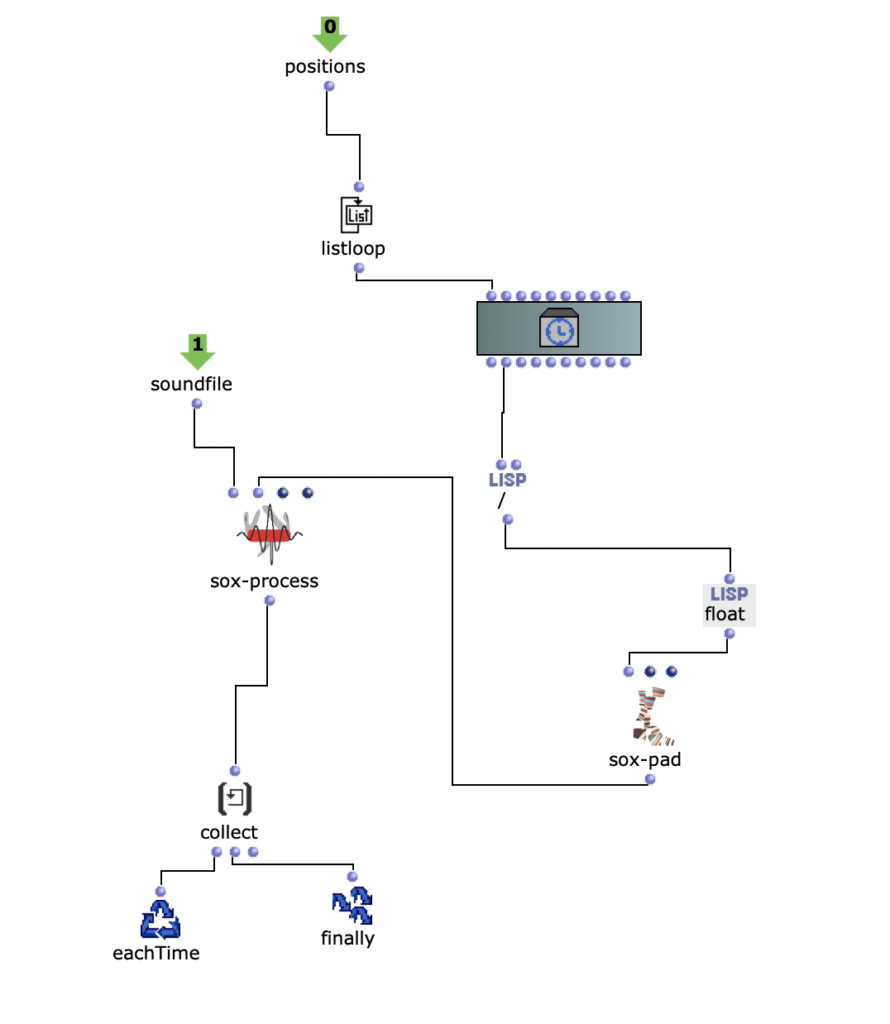
In the first level, it is first iterated over each element within the distance list. Each of these elements corresponds to a list that belongs to a virtual sound source, which contains the distances to each loudspeaker. Before the process enters the second level of the loop, further calculations are performed in a Lisp function using the current distance list.

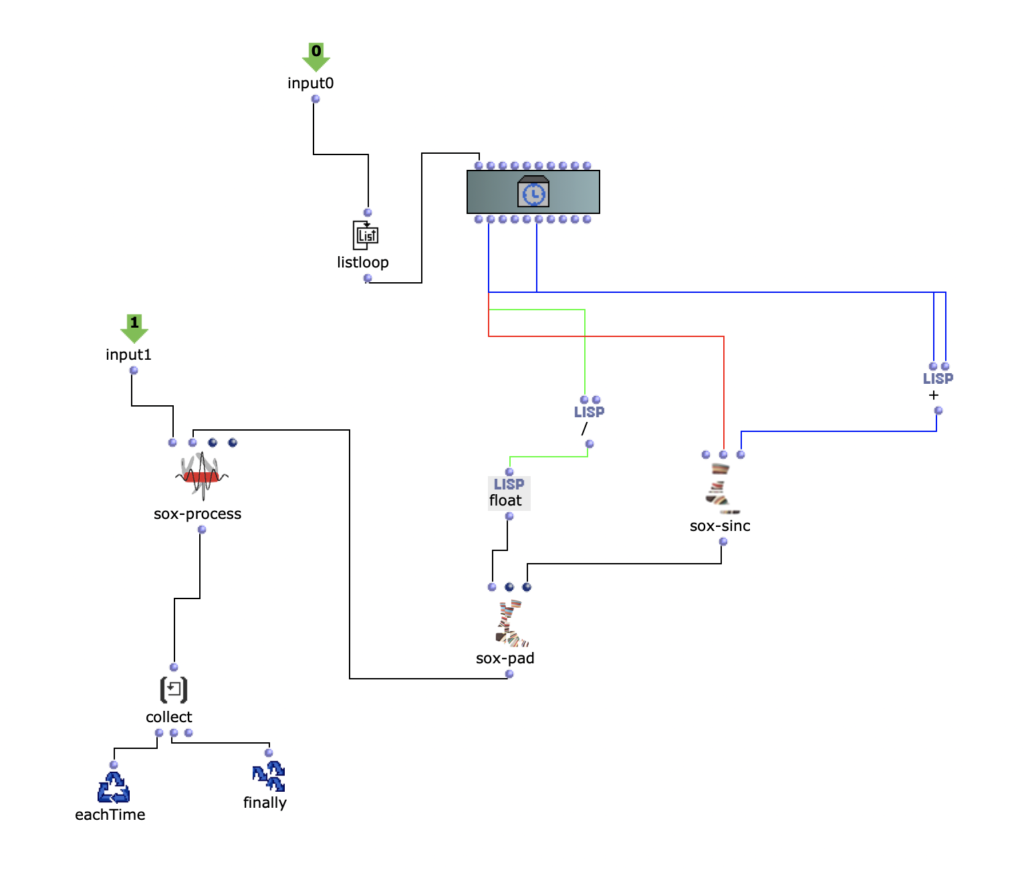
This function iterates over each distance and determines the time delay, volume reduction and a cutoff frequency for a lowpass filter to calculate the air absorption of high frequencies and collects them in a list. In the next step, the result of this Lisp function is used to enter the second level of the loop.


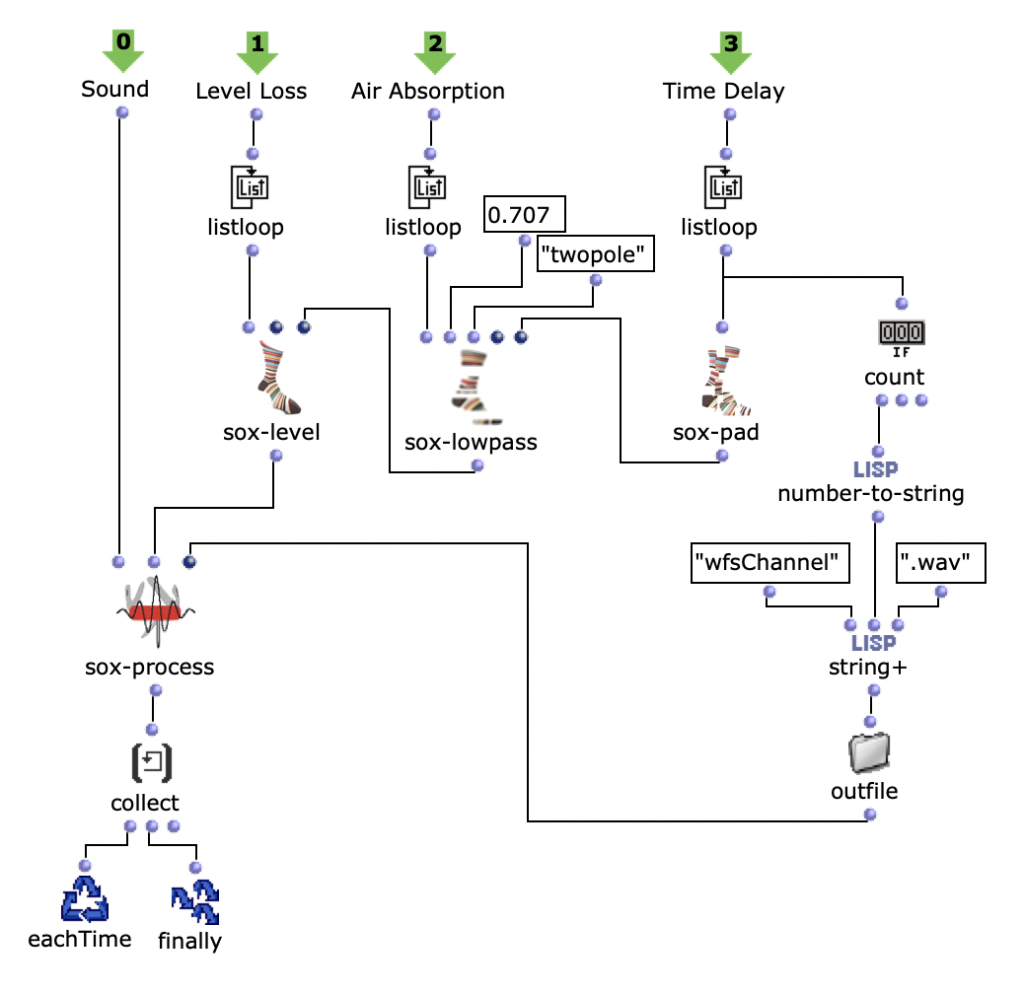
Here, the respective SoX effect is applied to the calculated value; SoX level for volume reduction, SoX lowpass for air absorption and SoX pad for the time delay. The resulting audio file is saved for each iteration. Each of the three lists has as many values as the previously calculated distances from the current sound source to the speakers. This means that each audio file saved in this loop represents one channel of the subsequent multi-channel file for the current sound source.

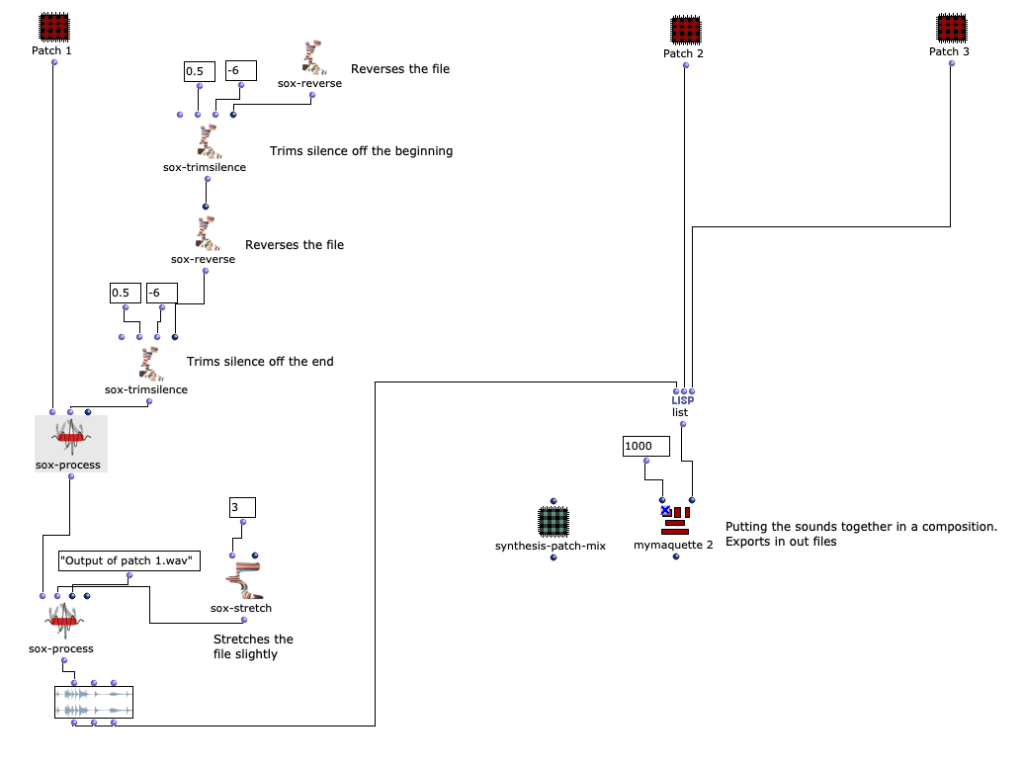
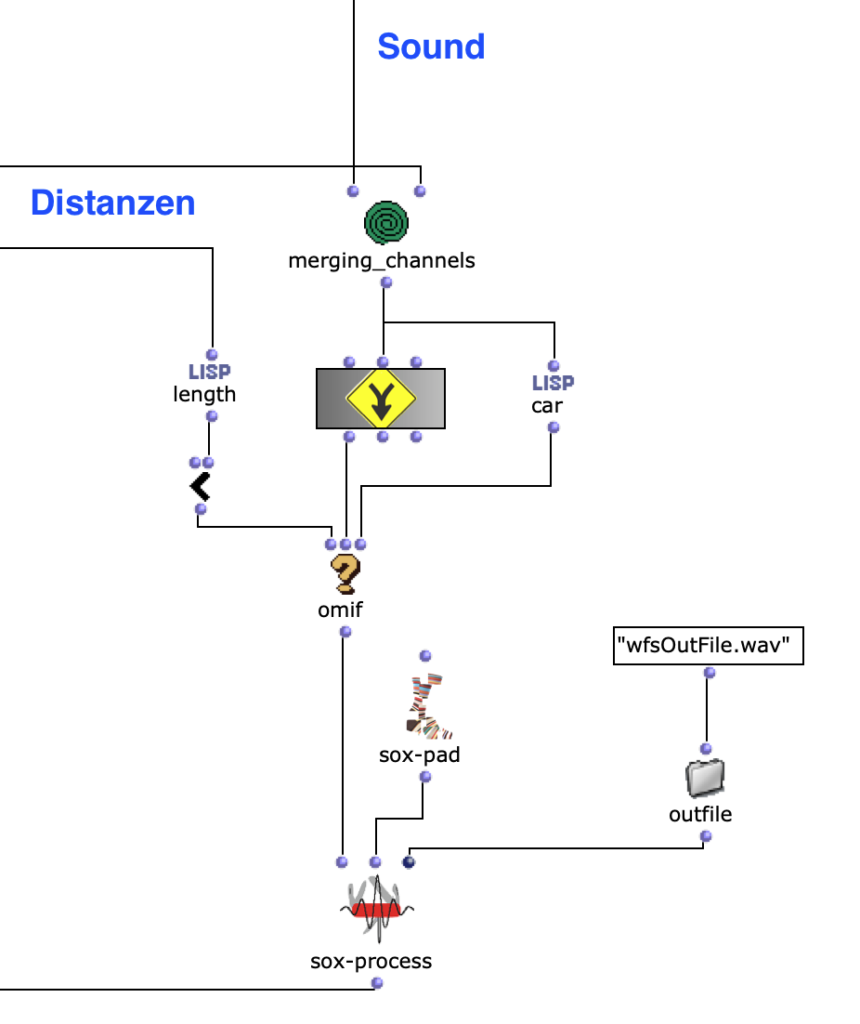
The multi-channel file can now be created in the next step in the first layer with SoX-Merge and stored temporarily at the end of the loop. This process is repeated for all remaining virtual sound sources (if existing) and are collected as the output of this upper loop. All multi-channel files of the respective sound sources are then merged with a SoX-Mix.

If only one virtual sound source is specified by the user, the output of the outermost loop will only consist of a single multi-channel file for this one source. In this case, the SoX-Mix is not required and it would even lead to an error during the evaluation of the program if the input of the SoX-Mix consisted of only one audio file. The OM-If therefore avoids the use of the SoX-Mix as soon as the output of the patcher, in which the distances are determined, only consists of one list, which means that only one circle for a virtual sound source has been drawn in the picture object.

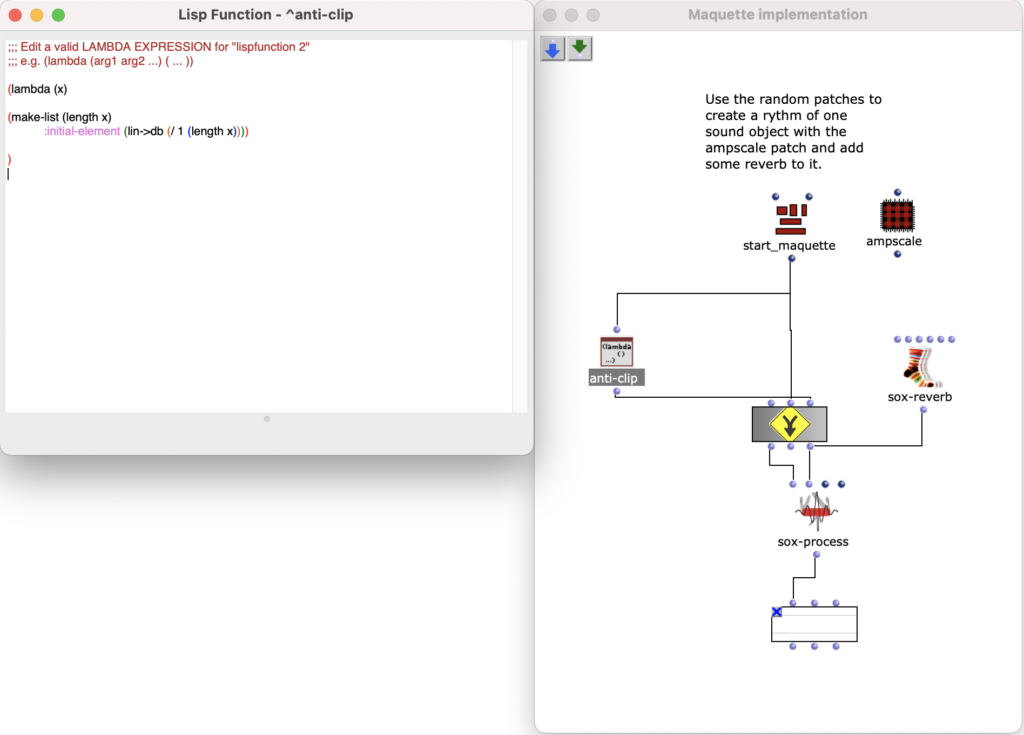
Finally, silence can be added to the multi-channel file using the SoX pad, depending on preference, if the selected audio file is particularly short, for example. At the same time, the final multi-channel file is saved in Outfile as “wfsOutFile.wav”.

ByMoritz Reiser

Markov processes for controlling harmonics in OpenMusic and Common Lisp

Abstract: A project on the use of random processes in a musical context. Basically, two different models are used. These generate chord sequences, which are then provided with a rhythm and an overlying melody.

Responsible: Moritz Reiser


Overview

The overall structure of the program, which corresponds to the content of the main patch, can be seen in Figure 1. At the top is the selection of the algorithm to be used for chord progression generation. This can be selected via the selection field at the top left. The two input fields of the subpatches can be used to specify the desired length and the starting chord or the key of the composition.

This is followed by a random determination of the respective tone lengths. Here you can set the tempo in BPM as well as the frequencies of the tone lengths occurring in multiples of quarter notes. The respective start times of the chords are calculated from the calculated durations using a “dx→x” function. When using the program, care must be taken here that Open Music calculates new random numbers in both strings due to the output being used twice, as a result of which the relationship between the start time and the tone duration is lost. This can be remedied by locking the subpatches for chord progression and tone length generation with “Lock Eval” after running the program once and then running it again to adjust the start times to the now saved tone durations (see information panel in the main patch). The third major step in the overall process is the generation of a melody that lies above the chord sequence. Here, a note is selected from the underlying chord and shifted up an octave. You can set whether this should always be a random chord tone or whether the tone closest to or furthest away from the preceding melody tone should be selected.

The result is then visualized at the bottom in a multi-seq object.

Figure 1: Overall structure of the composition process


Chord progression generation

Two algorithms are available for generating the chord sequence. The desired length of the sequence, which corresponds to the number of chords, and the starting chord or the key are transferred to them.

Harmonic chord sequence using Markov chain

The sequence of the first algorithm can be seen in Figure 2. The subpatch “Create Harmonic Chords” generates the basic set of chords that will be used in the following. This corresponds to the usual levels of counterpoint theory and, in addition to the tonic, subdominant, dominant and their parallels, contains a diminished chord on the seventh degree, a sixth ajoutée of the subdominant and a dominant seventh chord. The “Key” input adds a value corresponding to the desired key to these chords.

Figure 2: Subpatch for generating a harmonic chord sequence using a Markov chain

The “Create Transition Matrix” subpatch generates a matrix with transition probabilities for the individual chords. For each chord step, the probability with which it transitions to a certain other chord is determined. The probability values were chosen arbitrarily according to the usual processes in counterpoint theory and adjusted experimentally. For each chord it was investigated how likely it is to transition from this chord to another chord, so that the result corresponds to the conventions of counterpoint theory and allows a frequent return to the tonic level in order to focus on it. The exact transition probabilities are listed in the following table, whereby the initial sounds are listed in the left-hand column and the transitions are represented line by line.

Table 1. Transition probabilities of the harmonies of corresponding chord levels

The generation of the chord sequence finally takes place in the patch “Generate Markov Series”, which is shown in Figure 3. This initially only works with the numbering of the chord steps, which is why it is sufficient to pass it the length of the chord list. The Lisp function “Markov Synthesis” now generates a chord sequence of the desired length using the transition matrix. As it is not guaranteed that the last chord in the sequence generated in this way corresponds to the tonic, another Lisp function is used, which generates further chords until the tonic is reached. As the steps have only been numbered so far, the chords valid for the respective steps are finally selected in order to obtain the finished chord sequence.

Figure 3: Subpatch for generating a chord sequence using Markov synthesis

 
Chromatic chord progression using a tone net

In contrast to the harmonic chord progression, all 24 major and minor chords of the chromatic scale are used here (see Figure 4). The special feature of this algorithm lies in the choice of transition probabilities. These are based on a so-called tone network, which is shown in Figure 5.

Figure 4: Subpatch for generating a chord sequence based on the tone net representation

Figure 5: Tonnetz (image source:<https://jazz-library.com/articles/tonnetz/>)

Within the tone net, individual tones are applied and connected to each other. On the horizontal lines, the tones are each a fifth apart, while the diagonal lines show minor thirds (from top left to bottom right) and major thirds (from bottom left to top right). The resulting triangles each represent a triad, for example the triangle of the notes C, E and G results in the chord C major. All major and minor chords of the chromatic scale can be found. The Tonnetz representation is mostly used for analysis purposes, as a Tonnetz allows you to see directly how many tones two different triads share. One example is the analysis of classical music of the romantic and modern periods as well as film music, as the harmonic counterpoint rules used above are often neglected here in favor of chromatic and other previously unusual transitions. The distance between two chords in the tonal network can be a measure of whether the transition of one chord into the other is melodious or rather unusual. It is calculated from the number of edges that have to be crossed to get from one chord triangle to another. In other words, it corresponds to the degree of adjacency between two triangles, whereby a direct adjacency results from sharing an edge. Figure 6 shows an example of this: To get from the chord C major to the chord F minor, three edges have to be crossed, resulting in a distance of 3.

Figure 6: Example of determining the distance in the tone network using the transition from C major to F minor

As part of the project, the transition probabilities are now calculated on the basis of the distances between chords in the tone network. It is only necessary to distinguish whether the active triad is a major or minor chord, as the same distances to other chords result for all keys within these two classes. This means that every transition can be calculated from C major or C minor and then shifted to the desired key by adding a value. Starting from both variants (C major and C minor), the distances to all other triads were first recorded in the tonal network:

Distances from C major:

Intervals from C minor:

In order to obtain probabilities from the intervals, all values were first subtracted from 6 to make larger intervals less probable. The results were then used as the exponent of the number 2 in order to give greater weighting to closer chords. Overall, this results in the formula

P=2^(6-x) ; P=probability, x=distance in the grid

to calculate the transition weights. These result in the following matrix for all possible chord combinations, from which 342 probabilities result when divided by the row sum.

Within the patch, the Lisp function “Generate Tonnetz Series” first determines whether the active chord is a major or minor triad. As with the harmonic procedure, only the numbers 0-23 are used initially, this can be determined using a simple modulo-2 calculation. Depending on the result, the respective probability vector is used, a new chord is determined and finally the previous step is added. If the result is a number greater than 23, 24 is subtracted in order to always remain within the same octave.

After the previously determined length of the sequence, this section is finished. There is no return to the tonic as in the previous section, as the chromaticism means that the tonic is not as pronounced as in the harmonic chord sequence.

Determining the tone lengths

After a chord progression has been generated, random lengths are calculated for the individual triads. This is done in the “Calculate Durations” subpatch, which is shown in Figure 6. In addition to the desired BPM number, a list of note lengths is transferred as multiples of quarter notes. More probable values occur more frequently in this pool, so that a corresponding selection can be made via “nth-random”.

Figure 7: Subpatch for random determination of note durations

Melody generation

The basic melody generation process has already been described above: A tone is selected from the respective chord and transposed up an octave. This tone can be selected at random or according to the smallest or largest distance to the previous tone.


Sound examples

Example of a harmonic chord sequence:

Alex Player - Best audio player


Example of a tone net chord sequence:


Byadmin

BAD GUY: An acousmatic study

Abstract:

Inspired by the “Infinite Bad Guy” project, and all the very different versions of how some people have fueled their imaginations on that song, I thought maybe I could also experiment with creating a very loose, instrumental cover version of Billie Eilish’s “Bad Guy”.

Supervisor: Prof. Dr. Marlon Schumacher

A study by: Kaspars Jaudzems

Winter semester 2021/22
University of Music, Karlsruhe

To the study:

Originally, I wanted to work with 2 audio files, perform an FFT analysis on the original and “replace” its sound content with content from the second file, based only on the fundamental frequency. However, after doing some tests with a few files, I came to the conclusion that this kind of technique is not as accurate as I would like it to be. So I decided to use a MIDI file as a starting point instead.

Both the first and second versions of my piece only used 4 samples. The MIDI file has 2 channels, so 2 files were randomly selected for each note of each channel. The sample was then sped up or down to match the correct pitch interval and stretched in time to match the note length.

The second version of my piece added some additional stereo effects by pre-generating 20 random pannings for each file. With randomly applied comb filters and amplitude variations, a bit more reverb and human feel was created.

Acoustic study version 1

Acousmatic study version 2

The third version was a much bigger change. Here the notes of both channels are first divided into 4 groups according to pitch. Each group covers approximately one octave in the MIDI file.

Then the first group (lowest notes) is mapped to 5 different kick samples, the second to 6 snares, the third to percussive sounds such as agogo, conga, clap and cowbell and the fourth group to cymbals and hats, using about 20 samples in total. A similar filter and effect chain is used here for stereo enhancement, with the difference that each channel is finely tuned. The 4 resulting audio files are then assigned to the 4 left audio channels, with the lower frequency channels sorted to the center and the higher frequency channels sorted to the sides. The same audio files are used for the other 4 channels, but additional delays are applied to add movement to the multi-channel experience.

Acousmatic study version 3

The 8-channel file was downmixed to 2 channels in 2 versions, one with the OM-SoX downmix function and the other with a Binauralix setup with 8 speakers.

Acousmatic study version 3 – Binauralix render

Extension of the acousmatic study – 3D 5th-order Ambisonics

The idea with this extension was to create a 36-channel creative experience of the same piece, so the starting point was version 3, which only has 8 channels.

Starting point version 3

I wanted to do something simple, but also use the 3D speaker configuration in a creative way to further emphasize the energy and movement that the piece itself had already gained. Of course, the idea of using a signal as a source for modulating 3D movement or energy came to mind. But I had no idea how…

Plugin “ambix_encoder_i8_o5 (8 -> 36 chan)”

While researching the Ambix Ambisonic Plugin (VST) Suite, I came across the plugin “ambix_encoder_i8_o5 (8 -> 36 chan)”. This seemed to fit perfectly due to the matching number of input and output channels. In Ambisonics, space/motion is translated from 2 parameters: Azimuth and Elevation. Energy, on the other hand, can be translated into many parameters, but I found that it is best expressed with the Source Width parameter because it uses the 3D speaker configuration to actually “just” increase or decrease the energy.

Knowing which parameters to modulate, I started experimenting with using different tracks as the source. To be honest, I was very happy that the plugin not only provided very interesting sound results, but also visual feedback in real time. When using both, I focused on having good visual feedback on what was going on in the audio piece as a whole.

Visual feedback – video

Channel 2 as modulation source for azimuth

This helped me to select channel 2 for Azimuth, channel 3 for Source Width and channel 4 for Elevation. If we trace these channels back to the original input midi file, we can see that channel 2 is assigned notes in the range of 110 to 220 Hz, channel 3 notes in the range of 220 to 440 Hz and channel 4 notes in the range of 440 to 20000 Hz. In my opinion, this type of separation worked very well, also because the sub-bass frequencies (e.g. kick) were not modulated and were not needed for this. This meant that the main rhythm of the piece could remain as a separate element without affecting the space or the energy modulations, and I think that somehow held the piece together.

Acousmatic study version 4 – 36 channels, 3D 5th-order Ambisonics – file was too big to upload

Acoustic study version 4 – Binaural render

Byadmin

Spectral Select: An acousmatic 3D audio study


Abstract:
Spectral Select explores the spectral content of one sample and the amplitude curve of a second sample and unites them in a new musical context. The meditative character of the output created by iteration is both contrasted and structured by louder amplitude peaks.
In a revised version, Spectral Select was spatialized in Ambisonics HOA-5 format.

Supervisor: Prof. Dr. Marlon Schumacher

A study by: Anselm Weber

Winter semester 2021/22
University of Music, Karlsruhe


About the study:
In which forms of expression is the connection between frequency and amplitude expressed ? Are both areas intrinsically connected and if so, what could be approaches to redesigning this order?
Such questions have occupied me for some time. That’s why the attempt to redesign them is the core topic of Spectral Select.
I was inspired by AudioSculpt from IRCAM, which we got to know in our course: “Symbolic Sound Processing and Analysis/Synthesis” together with Prof. Dr. Marlon Schumacher and Brandon L. Snyder and which we partially rebuilt.

Spectral Edit works on a similar principle, but instead of having a user work out interesting areas within a spectrum of a sample, it was decided to use a second audio sample. This additional sample (from now on referred to as “amplitude sound” in the course of this article) determines how the first sample (from now on referred to as “spectral sound”) is to be processed by OM-Sox.
To achieve this, two loops are used:
First, individual amplitude peaks are analyzed out of the amplitude sound in the first “peakloop”. This analysis is then used in the heart of the patch, the “choosefreq” loop, to select interesting sub-ranges from the spectral sample. Loud peaks filter narrower bands from higher frequency ranges and form a contrast to weaker peaks, which filter somewhat broader bands from lower frequency ranges.

peakloop – Analysis
choosefreq Loop – Audio Processing


How small the respective iteration steps are affects both the length and the resolution of the overall output. Depending on the sample material, a large number of short grains or fewer but longer subsections can be created. However, both of these parameters can be selected freely and independently of each other.

In the enclosed piece, for example, a relatively high resolution (i.e. an increased number of iteration steps) was chosen in combination with a longer duration of the cut sample. This creates a rather meditative character, whereby no two sections will be 100% identical, as there are constantly minimal changes under the peak amplitudes of the amplitude sound.
The still relatively raw result of this algorithm is the first version of my acousmatic study.

Acousmatic study version 1


The subsequent revision step was primarily aimed at working out the differences between the individual iteration steps more precisely. For this purpose, a series of effects were used, which in turn behave differently depending on the peak amplitude of the amplitude sound. To make this possible, the series of effects was integrated directly into the peak loop.

Acousmatic study version 2


In the third and final revision step, the audio was spatialized to 8 channels.
The individual channels sound into each other and change their position in a clockwise direction. This means that the basic character of the piece remains the same, but it is now also possible to follow the “working through” of the choosefreq loop spatially. To maintain this spatiality, the output was then converted to binaural stereo for the upload using Binauralix.

Acoustic study version 3 – Binaural


Spectral Select – Ambisonics

In the course of a further revision, Spectral Select was re-spatialized using the spatialization class “Hoa-Trajectory” from OM-Prisma and converted to the Ambisonics format.
To ensure that this step fits in well conceptually and sonically with the previous edits, the amplitude sound should also play an important role in the spatial position.
The possibilities for spatializing sounds with the help of Open Music and OM Prism are numerous. In the end, it was decided to work with Hoa-Trajectory. Here, the sound source is not bound to a fixed position in space and can be described with a trajectory that is scaled to the total duration of the audio input.

Spatialization with HOA.TRAEJECTORY


The trajectory is created depending on the amplitude analysis in the previous step.
A simple, three-dimensional circular movement, which spirals downwards, is perturbed with a more complex, two-dimensional curve. The Y-values of the more complex curve correspond to the analyzed amplitude values of the amplitude sound.
Depending on the scaling of the amplitude curve, this results in more or less pronounced deviations in the circular motion. Higher amplitude values therefore ensure more extensive movements in space.


It is interesting to note that OM-Prisma also takes Doppler effects into account. As a result, it is also audible that at higher amplitude values, more extreme distances to the listening position are covered in the same time. This step therefore has a direct influence on the timbre of the entire piece.
Depending on the scaling of the trajectory, fast movements can be strongly overemphasized, but artifacts can also occur (if the distance is too great).
To get a better impression, 2 different runs of the algorithm with different distances to the listener follow.


Version with extreme Doppler effects which can result in artifacts – binaural stereo

Versionwith closer distance and more moderate Dopp ler effects – Binaural Stereo


In contrast to the previous sound examples, the spectral sound and amplitude sound have been replaced in this example. This is a longer sound file for analyzing the amplitudes and a less distorted drone as a spectral sound.
The idea behind this project is to experiment with different sound files anyway.
Therefore, the old algorithm has been reworked to offer more flexibility with different sound files:

Revised scalable version of the old algorithm for selecting from the spectral sound

In addition, a randomized selection is now made from the spectral sound on the time axis. As a result, any shaping context should come from the magnitude of the amplitude sound and any timbre should be extracted from the spectral sound.


ByVeronika Reutz

Composing in 8 channels with OpenMusic

In this article I present my ideas, creative processes and technical data for the patch programmed for the class “Symbolic Sound Processing and Analysis/Synthesis” with Prof. Marlon Schumacher. The idea of this text is to show the technical solutions for my creative ideas and to share the knowledge gained to help the reader with their ideas. The purpose of this patch is to take sounds from everyday life and transform them into your own composition using several processes within Open Music.

Responsible: Veronika Reutz Drobnić, winter semester 21/22

Introduction, Iteration 1

The initial idea of the piece was to transform everyday sounds, for example the sound of a kettle, into a different, processed sound by implementing technical solutions in Open Music. This patch processes and merges several files into one composition. There are three iterations of the patch that I worked on during the semester. I will describe them in chronological order.

The original idea for the patch came from musique concréte. I wanted to make a 2-minute piece from concrete sounds (not synthesized in Open Music, but recorded). This patch consists of three subpatches that are connected to the maquette in the main patch.

The main patch

Read More

Pages: 1 2 3

Byadmin

Acousmatic study by Zeno Lösch

This article is about the three iterations of an acousmatic study by Zeno Lösch, which were carried out as part of the seminar “Symbolic Sound Processing and Analysis/Synthesis” with Prof. Dr. Marlon Schumacher at the HfM Karlsruhe. It deals with the basic conception, ideas, constructive iterations and the technical implementation with OpenMusic.

Responsible persons: Zeno Lösch, Master student Music Informatics at HfM Karlsruhe, 1st semester


Idea and concept


I got my inspiration for this study from the Freeze effect of GRM Tools.

This effect makes it possible to layer a sample and play it back at different speeds at the same time.

With this process you can create independent compositions, sound objects, sound structures and so on.

My idea is to program the same with Open Music.

For this I used the maquette and om-loops.

In the OpenMusicPatch you can find the different processes of layering the source material.

The source material is a “filtered” violin. This was created using the cross-synthesis process. This process of the source material was not created in Open Music.

Source material


Music cannot exist without time. Our perception connects the different sounds and seeks a connection. In this process, also comparable to rhythm, the individual object is connected to other objects. Digital sound manipulation makes it possible to use processes to create other sounds from one sound, which are related to the same sound.

For example, I present the sound in one form and change it at another point in the composition. This usually creates a connection, provided the listener can understand it.

You can change a transposition or the pitch in a similar way to notes.

This changes the frequency of a note. With digital material, this can lead to very exciting results. On a piano, the overtones of each note are related to the fundamental. These are fixed and cannot be changed with traditional sheet music.

With digital material, the effect that transposes plays a very important role. Depending on the type of effect, I have various possibilities to manipulate the material according to my own rules.

The disadvantage with instruments is that with a violin, for example, the player can only play the note once. Ten times the same note means ten violins.

In OpenMusic it is possible to play the “instrument” any number of times (as long as the computer’s processing power allows it).


Process

To recreate the Grm-Freeze, a moquette was first filled with empty patches.

Filling a moquette with empty patches


The soundfile was then rendered from the moquette with an om-loop to the positions of the empty patches.

Loop for soundfile positions


The following code was used to avoid clipping.

Sox-Mix and Anti Clip


Layer Study first iteration


The source material is presented at the beginning. In the course of the study, it is repeatedly changed and stacked in different ways.

The study itself also plays with the dynamics. Depending on the sound stacking algorithm, the dynamics in each sound object are changed. As there is more than one sound in time, these sounds are normalized depending on how many sounds are present in the algorithm to avoid clipping.

The study begins with the source material. This is then presented in a different temporal sequence.

This layer is then filtered and is also quieter. The next one develops into a “reverberant” sound. A continuum. The continuum remains it is presented differently again.

In the penultimate sound, a form of glissandi can be heard, which again ends in a sound that is similar to the second, but louder.

The process of stacking and changing the sound is very similar for each section.

The position is given by the empty patch in the moquette.

Then the y-position and x-position parameters are used for modulation

Implementation of the x and y positions as modulation parameters
Layer study first iteration


Layer Study second iteration

I tried to create a different stereo image for each section.

Different rooms were simulated.

One technique that was used is the mid/side.

In this technique, the mid and side are extracted from a stereo signal using the following process:

Mid = (L R) * 0.5

Side = (L – R) * 0.5

An aural exciter has also been added.

In this process, the signal is filtered with a high-pass filter, distorted and added back to the input signal. This allows better definition to be achieved.

Through the mid/side, the aural exciter is only applied to one of the two and it is perceived as more “defined”.

To return the process to a stereo signal, the following process is used:

L = Mid Side

R = Mid – Side

Mid Side process


To further spatialize the sound, an all-pass filter and a comb filter were used to change the phase of the mid or side component.

Decorrelation of the phase


Layer Study Stereo


Layer Study third iteration

In this iteration, the stereo file was divided into eight speakers.

The different sections of the stereo composition were extracted and different splitting techniques were used.

In one of these, a different fade in and fade out was used for each channel.

In an acousmatic version of a composition, this fade in and fade out can be achieved with the controls of a mixer.

A mapcar and repeat-n were used for this purpose.

Random fades for multichannel

The position of the respective channels was changed in the other processes. A delay was used.

Multichannel delay

The final version is available on 2 channels.

Downmix Layer Study 8 channels to 2 channels


ByLorenz Lehmann

“OM-LEAD” library

Abstract:

The library “OM-LEAD” is a library for rule-based, computer-generated real-time composition. The considerations and approaches in Joseph Branciforte’s text “FROM THE MACHINE: REALTIME ALGORITHMIC APPROACHES TO HARMONY AND ORCHESTRATION” are the starting point for the development.

The library currently comprises two functions that are written using both CommonLisp and existing functions from the OM package.

In addition, the composition is currently limited in the scope of the parameters to be controlled to the harmonics and the voice leading.

In the future, I would also like to write a function that allows composition on a temporal level with the parameters metrics and cue spacing.

Development: Lorenz Lehmann

Supervision and advice: Prof. Dr. Marlon Schumacher

My sincere thanks for their kind support go to Joseph Branciforte and

Prof. Dr. Marlon Schumacher.

Read More

Pages: 1 2 3 4