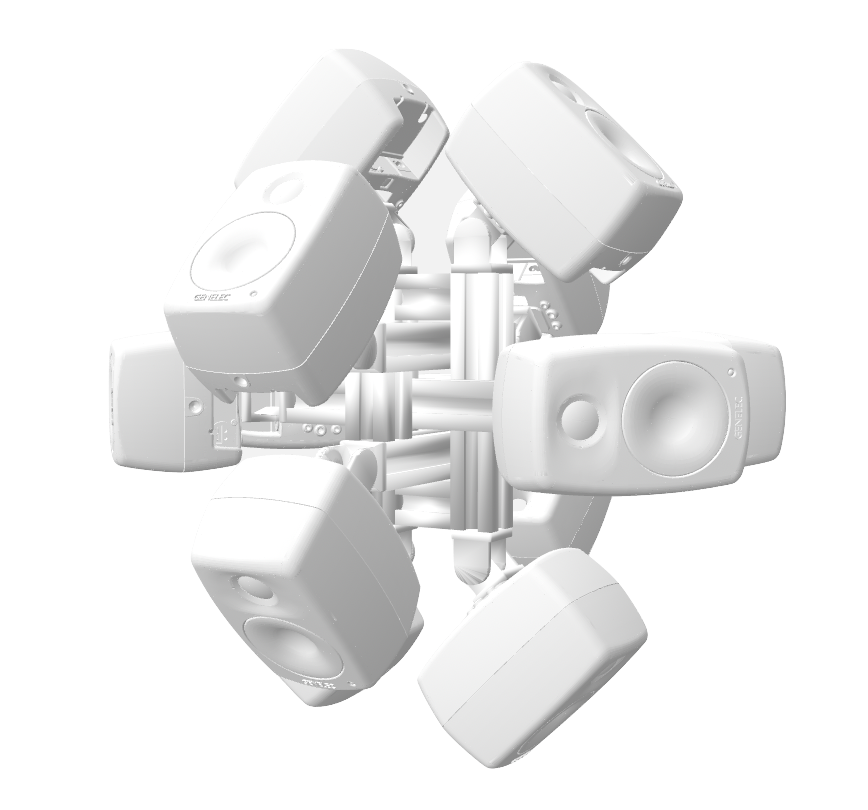
DIRAC (D_istributed I_nteractive R_adial A_udio C_luster) ist ein vielseitig einsetzbares räumliches Audiogerät, welches aus einem Cluster von vernetzten Lautsprechern und Einplatinen-Computern in einer radialen Konfiguration besteht (Lautsprecher, die strahlen- bzw. sternförmig nach außen gerichtet sind, siehe Abb. 1). Es wurde von Prof. Schumacher konzipiert, entworfen und realisiert mit Unterstützung von industriellen und privaten Partnern aus den Bereichen Musiktechnologie, Maschinenbau, IT und Industriedesign, wie z.B. RobotUnits, Augmented Instruments, Sonible, Janis Streib und Garvin Schultheiß. Es kann als Hybrid zwischen kompakt-sphärischem Lautsprecherarray, interaktiver Klangskulptur und Mehrkanal-Lautsprecheranordnung betrachtet werden.
Hintergrund:
Die Verwendung von Lautsprechern in der zeitgenössischen Musik kann heutzutage als integraler Bestandteil des Instrumentariums elektroakustischer Komponisten und Klangkünstler angesehen werden. Obwohl die künstlerischen An- und Einsätze vielfältig sind, lassen sie sich entlang eines Kontinuums kategorisieren, das von ihrer Funktion als klingendes Objekt mit einer intendierten akustischen Identität und Richtcharakteristik (Klangabstrahlung) erstreckt, bis hin zu ihrer Verwendung als akustisch neutrales Element eines Arrays von Lautsprechern, die oft in einer die Hörenden umgebenden Konfiguration eine klangliche Umhüllung oder Projektion erzeugen (Klangprojektion). Während bei den erstgenannten Ansätzen der Lautsprecher häufig als eine Komponente betrachtet wird, die in die Umgebung eingebettet ist und mit dieser interagiert (z. B. Wandreflexionen usw.), wird bei den letztgenannten Ansätzen häufig versucht, akustische Interaktionen mit dem Raum zu minimieren oder zu „neutralisieren“, da diese häufig als unbeabsichtigte Artefakte des Reproduktionssystems angesehen werden.

Illustration eines Kontinuums von Schallabstrahlung bis Schallprojektion. Die obere Linie steht für künstlerische Praktiken, die untere für technische Entwicklungen und Installationen
DIRAC entstand aus der Idee, einen flexiblen Rahmen und eine technologische Infrastruktur zu entwickeln, die es ermöglicht, einzelne Lautsprecher sowohl im Sinne von Instrumenten mit unterschiedlichen akustischen Signaturen zu verwenden, sowie als neutraler, radialer Klangabstrahler (für die Reproduktion von Klangrichtmustern) und für interdisziplinäre Klangkunst/Installationskontexte. Die Möglichkeiten zur Audioreproduktion reichen von der Synthese und Wiedergabe von kanalbasiertem Material (in der Tradition der Klangdiffusion) bis hin zur Wiedergabe von Ambisonics und akustischem Beamforming. Es gibt bereits einen beachtlichen Korpus von Forschungsarbeiten zu sphärischen Lautsprecherarrays (einige davon für den kommerziellen Markt entwickelt, s. Referenzen), doch bei den meisten Entwicklungen handelt es sich entweder um Laborprototypen, die auf kundenspezifische Komponenten und spezielle Hardware angewiesen sind, oder um proprietäre Produkte, die auf den Support und die Wartung durch Dritte angewiesen sind.
Anstatt auf einer Einheitslösung aufzubauen, die teuer in der Herstellung, restriktiv in der Anpassungsfähigkeit und schwierig in der Wartung und Erweiterung sein könnte, waren hier die Schlüsselfaktoren Modularität (Anpassungsfähigkeit für Forschungs- und künstlerische Zwecke), Nachhaltigkeit durch Austauschbarkeit der Komponenten (unter Verwendung handelsüblicher Hardware) und Erweiterbarkeit.
Um die Flexibilität zu optimieren, basiert unser Design auf dem Konzept der „Audioknoten“, die Audiosenken (Lautsprecher) mit Recheneinheiten (die sich ihrer Umgebung bewusst sind, indem sie Sensordaten und andere Informationen austauschen) kombinieren, die in einem verteilten Netzwerkcluster kommunizieren und offene Standards und Rechenplattformen nutzen. Um die Installationszeit zu minimieren und die künstlerische Praxis zu erleichtern, wollten wir die notwendige technische Infrastruktur und den logistischen Aufwand auf ein Minimum beschränken.
Anstatt kundenspezifische Hardware zu entwickeln, basiert das Design auf Technologien aus den Bereichen Ubiquitous Computing und Smart Devices, um die notwendige technische Infrastruktur und den logistischen Aufwand so gering wie möglich zu halten und gleichzeitig die notwendigen Funktionalitäten bereitzustellen, die es dem Cluster ermöglichen, sich an die Bedingungen seiner Umgebung anzupassen (z. B. für die Klangprojektion) und künstlerische Praktiken zu erleichtern, die Mensch-Computer- oder andere Formen der Interaktion beinhalten.
Mechanische Struktur und Halterungen
Für den Bau der mechanischen Tragstruktur und der Halterungen werden CNC-gefräste Aluminiumprofile aus dem Bereich der Robotik und des Maschinenbaus verwendet, die sich durch Modularität, Präzision, Erweiterbarkeit (Baukastensystem), geringes Gewicht und komfortable Kabelführung auszeichnen. Die folgenden Abbildungen veranschaulichen die Konstruktionen der Tragstruktur.
Für die Synthese von Richtcharakteristiken eignen sich kompakte, kugelförmige Lautsprecherarrays in Form platonischer Körper aufgrund ihrer symmetrischen geometrischen Eigenschaften, die bestimmte Bereiche/Richtungen nicht begünstigen. Ein gängiger Ansatz für die Richtcharakteristiksynthese ist die Verwendung sphärischer Obertöne, die kombiniert werden können, um mehrere Schallkeulen in bestimmten Richtungen zu erzeugen. Frühere Forschungsarbeiten haben ergeben, dass eine Konfiguration von 12 regelmäßig auf einer Kugel (Dodekaeder) angeordneten Lautsprechern den besten Kompromiss unter den platonischen Körpern zwischen der Anzahl der Kanäle, der Schallleistung und der Komplexität der steuerbaren Muster darstellt.
Obwohl beliebige Anordnungen technisch möglich sind (z. B. eine dodekaedrische Anordnung), haben wir uns für eine Konfiguration entschieden, bei der die Lautsprecher an den Ecken von drei zueinander senkrechten Rechtecken mit goldenem Schnitt (den Eckpunkten eines Ikosaeders) platziert sind, um ein Höchstmaß an Flexibilität zu erreichen, da die symmetrische Lautsprecherkonfiguration die Wiedergabe verschiedener Audiowiedergabeformate ermöglicht, einschließlich horizontaler (Stereo, Quad, Hexaphon) und periphoner Formate (Würfel/Hexaeder).
NB: Es gibt Prototypen für eine unterschiedliche Anzahl von Knotenpunkten in verschiedenen geodätischen Konfigurationen (z. B. halbkugelförmig, ikosaedrisch usw.).
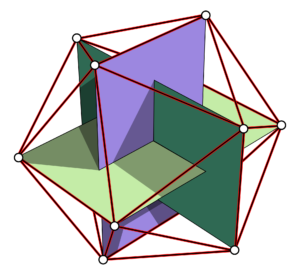
Abb.1: Drei senkrechte Rechtecke im Goldenen Schnitt bilden ein regelmäßiges Ikosaeder mit 12 Scheitelpunkten.
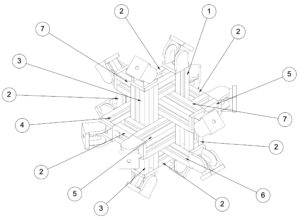
Abb. 2: Technische Zeichnung der Aluminiumstruktur und der Halterungen an den Scheitelpunkten eines regelmäßigen Ikosaeders
Technische Konfiguration und Konnektivität
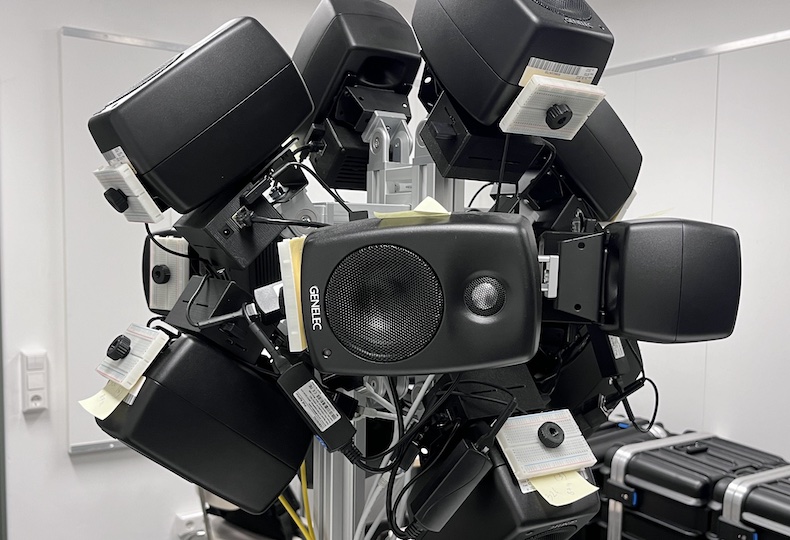
Jeder Cluster-„Node“ besteht aus einer Smart-IP-Lautsprechereinheit (digitale Lautsprecher mit programmierbaren DSP-Einheiten) und einem dedizierten Einplatinen-Computer (BELA oder Raspberry Pi), der über ein speziell angefertigtes 3D-gedrucktes Gehäuse am Lautsprecher angebracht ist und zusätzliche Verarbeitungsfunktionen und Anschlussmöglichkeiten für verschiedene Peripherie (Mikrofone, Sensoren, Wandler usw.) bietet, die alle durch ein gemeinsames DANTE- und lokales Netzwerk für die Übertragung von Audiosignalen und allgemeine Kommunikation verbunden sind. Zur Erleichterung der Entwicklung elektrischer Schaltkreise wurden spezialangefertigte Halterungen für Breadboards entwickelt. In der gegenwärtigen Konfiguration werden 12 Genelec 4410A Smart Speaker und entsprechende eingebettete Computer eingesetzt, die alle über Netgear AV Line-Switches verbunden sind, welche Power-Over-Ethernet, Audio, Konfiguration und Netzwerkkommunikation über ein einziges Ethernet-Kabel bereitstellen. Abb. 4 zeigt einen frühen Prototyp des DIRAC-Aufbaus (Breadboards wurden in einer späteren Entwicklungsphase hinzugefügt).
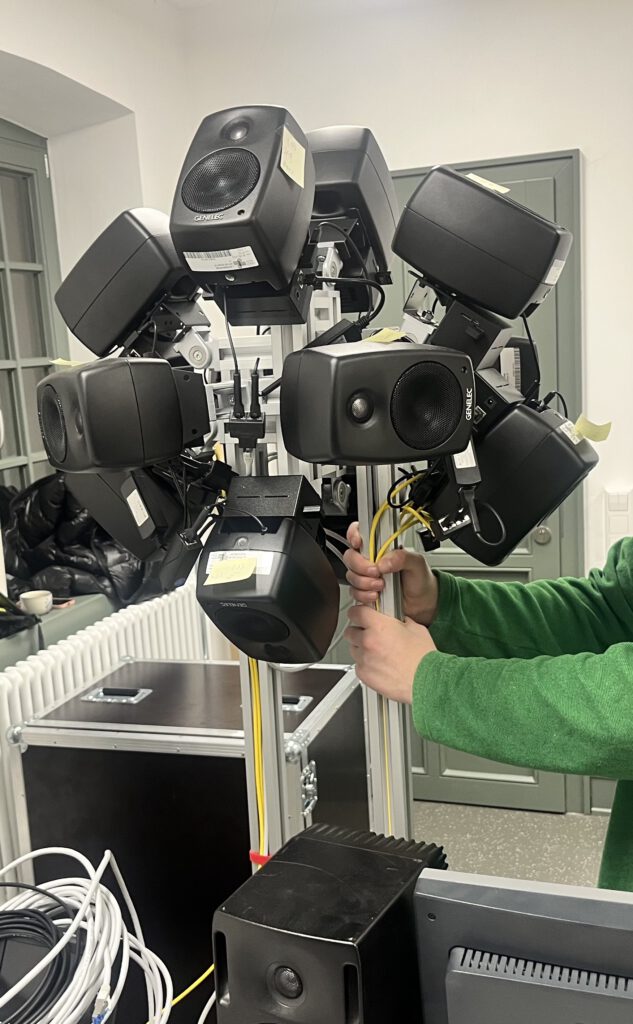
Abb. 4: Fotografische Aufnahme des DIRAC auf einer vertikalen Stützstruktur. Die menschlichen Hände/Arme sind maßstabsgetreu dargestellt
Kontrolle und aktuelle Entwicklungen
Neben proprietärer Software(SmartIP Manager von Genelec) können die internen DSP-Einstellungen über eine API konfiguriert werden. Aktuelle Entwicklungen für eine generische, quelloffene Netzwerksoftware mit Auto-Discovery- und Management-Funktionen unter Verwendung des generischen OpenSoundControl-Messagings sind im Gange(siehe dieses Git-Repository). Da sowohl Dante als auch AES67 für die Audio-over-IP-Übertragung unterstützt werden, gibt es außerdem aktuelle Entwicklungen, um Unterstützung für BELA und RaspberryPis hinzuzufügen, um das Audionetzwerk mit zusätzlichen Wandlern (Mikrofonen, Audio-Excitern usw.) zu erweitern/interagieren, siehe dieses und dieses Repository. Es gibt auch laufende Entwicklungen zur Integration von Sensorik, um den Cluster auf seine Umgebung aufmerksam zu machen, z. B. über Näherungssensorik, siehe dieses Repository.
Audio-Rendering
Wir evaluieren und experimentieren derzeit mit einer Reihe verschiedener Ansätze: kanalbasiertes Material (unter Verwendung direkter Lautsprechereinspeisungen), Panning-/Spatialisierungsalgorithmen wie VBAP, DBAP, etc. , Ambisonics (z. B. mit Allrad-Decodern), virtuelle Mikrofone und Beamforming. In Kombination mit vernetzter Sensorik kann so ein breites Spektrum von Anwendungen abgedeckt werden, vom adaptiven Rendering bis zur interaktiven Synthese.
Literatur:
- Pasqual, A. M., Arruda, J. R., & Herzog, P. (2010, May). A comparative study of platonic solid loudspeakers as directivity controlled sound sources. In Proceedings of the second international symposium on Ambisonics and spherical acoustics.
- Pasqual, A. M. (2010). Sound directivity control in a 3-D space by a compact spherical loudspeaker array (Doctoral dissertation, Universidade Estadual de Campinas)
- Avizienis, R., Freed, A., Kassakian, P., & Wessel, D. (2006, May). A compact 120 independent element spherical loudspeaker array with programable radiation patterns. In Audio Engineering Society Convention 120. Audio Engineering Society
- Freed, A., Schmeder, A., & Zotter, F. (2008). Applications of environmental sensing for spherical loudspeaker arrays. IASTED Signal and Image Processing
- Schmeder, A. (2009, June). An exploration of design parameters for human-interactive systems with compact spherical loudspeaker arrays. In Proceedings of the Ambisonics Symposium.
- Farina, A., & Chiesi, L. (2016, May). A novel 32-speakers spherical source. In Audio Engineering Society Convention 140. Audio Engineering Society
